Realtime rVOL w/ Candle Highlight [Blk0ut]About This Script
Realtime rVOL Table + Candle Highlight (Presets, No Smoothing)
By Blk0ut
This tool visualizes real-time relative volume (rVOL) directly on your chart and in a compact table, helping traders identify where intraday participation deviates from the session’s baseline.
Unlike standard volume overlays, this script recalculates rVOL dynamically through the session and highlights candles when participation exceeds configurable thresholds — providing a clear picture of ignition zones, volume surges, and potential breakout conditions.
Core Features
-Realtime rVOL tracking: Displays the current bar’s relative volume ratio compared to a moving baseline of recent bars.
-Preset Profiles: Choose from four purpose-built profiles to quickly adjust the rVOL sensitivity to your trading horizon.
----------------------------------------------------------------------
*Opening Rush: 100-bar lookback, threshold 2.5*
*RTH 5m: 30-bar lookback, threshold 1.2*
*RTH 1hr: 50-bar lookback, threshold 1.5*
*RTH 1d+: 100-bar lookback, threshold 1.5*
----------------------------------------------------------------------
RTH-only filter: Option to limit the moving average baseline to regular market hours (09:30–16:00).
Candle highlighting: Optionally outlines candles when rVOL exceeds the active threshold to emphasize spikes visually in real time.
Table display: Compact dashboard showing current rVOL, raw volume, average baseline, and preset parameters.
How To Use
Select a preset that matches your timeframe or trading style.
Scalpers and open traders can use RTH 5m or Opening Rush.
Position or swing traders may prefer RTH 1hr or RTH 1d+.
Watch for rVOL readings above the threshold (and colored candle outlines). These often correspond to momentum ignition, news impact, or institutional activity.
Combine with VWAP, ORB, or intraday key levels for best confirmation.
Notes
The table automatically adapts to your chart corner choice.
Highlight thresholds can follow the preset or be set manually.
Color intensity tiers (High/Medium/Low) can be tuned in settings.
Designed for intraday and session-based traders who rely on live volume context rather than end-of-day stats.
ابحث في النصوص البرمجية عن "key levels"

NS ND - EVR - Daily Bias - TRFxVolume & Price Action Signals
What It Does
Combines three proven trading methodologies: Effort vs Result (EVR), No Supply/No Demand (NS/ND), and Daily Bias tracking for intraday traders.
Features
Effort vs Result (EVR)
- **Bullish**: Green triangle below bar when price sweeps previous low with high volume and significant wick
- **Bearish**: Red triangle above bar when price sweeps previous high with high volume and significant wick
- Identifies potential reversals where volume doesn't match price movement
No Supply / No Demand (NS/ND)
- **No Demand (Red dot)**: Up-candle with declining volume - buyers weakening
- **No Supply (Green dot)**: Down-candle with declining volume - sellers weakening
- Grey dots = unconfirmed, colored dots = confirmed within lookahead period
- Based on Volume Spread Analysis (VSA) principles
Daily Bias Label
Top-right corner shows market direction:
- **BULLISH ↑** - Closed above Previous Day High
- **BEARISH ↓** - Closed below Previous Day Low
- **BULLISH/BEARISH REV** - Swept level but closed back inside
- **RANGE ↔** - Trading between PDH/PDL
## Settings
- **EVR**: Toggle on/off, volume multiplier, wick %, inside bars, transparency
- **NS/ND**: Toggle on/off, lookahead bars (default: 10)
- **Daily Bias**: Toggle label display
## Best For
✓ Intraday trading (1m-1h timeframes)
✓ Reversal setups
✓ Volume analysis
✓ Confluence trading (all signals align)
How to Use
1. Enable components you want (all can be toggled independently)
2. Trade EVR signals in direction of Daily Bias
3. Look for NS/ND confirmation at key levels
4. Wait for colored dots (confirmed signals) over grey (unconfirmed)
**Note**: Works on intraday timeframes only. NS/ND signals may repaint during confirmation period.

All Key Levels CompleteHave lines created for Yesterday Close, Prior Day High, Prior Day -1 Close, Prior Day Low, Prior Day -1 Low, Premarket High and Premarket Low.

OR Box + Full Key Levels (Cash Hours • Strict v5)This is the final working script, just choose from the drop down to adjkust for Europeon / US markets

Volume Pressure Arrows[Blk0ut]Volume Pressure Arrows are an innovative (I think) market pressure tool designed to cut through noise and provide traders with a realistic, but quick insight into buying vs selling pressure and which has real control. Rather than relying on any single classic indicator, this script blends five complementary measures of price–volume dynamics—Cumulative Volume Delta (CVD), VWAP distance, OBV slope, ATR expansion, and the DMI ratio—into a unified “pressure score.”
Each component is normalized, weighted, and combined into a single metric that can be read at a glance through intuitive up and down arrows plotted directly on the chart. By transforming multiple complex data streams into a single aggregated signal, Volume Pressure Arrows help traders answer some of the hardest questions we can face: is the current move backed by conviction? is there true momentum? Is price action about to reverse?
Why It’s Different
Traditional oscillators often create conflicting signals, forcing traders to guess which one to trust. This indicator integrates five perspectives on volume and momentum pressure into a single framework, balancing raw flow (CVD), relative positioning (VWAP), trend conviction (OBV slope), volatility expansion (ATR), and directional bias (DMI). The result is a weighted, probability-minded score capped between -100 and +100 for consistency and clarity.
Important note : Inspiration for the use of directly plotted arrows came from dgtrd "https://www.tradingview.com/u/dgtrd/" and their brilliant work on LazyBear's Squeeze Indicator "https://www.tradingview.com/script/Dsr7B2xE-Squeeze-Momentum-Indicator-LazyBear-vX-by-DGT/"
How to Read It
Bullish Arrows appear below the candles when the pressure score pushes above the neutral threshold, signaling meaningful buyer dominance.
Bearish Arrows appear above the candles when pressure drops below the negative threshold, indicating strong selling pressure.
Neutral Arrows (smaller, faded) mark conditions where pressure exists but is not decisive—useful for spotting early rotations or fading momentum.
Color Gradients dynamically adjust with score intensity, making stronger signals visually brighter and weaker ones softer.
How to Use It Effectively
This tool is best applied as a confirmation and timing layer. It is not meant to replace your core strategy, but to validate whether momentum pressure supports your trade thesis.
Combine with trendlines, chart patterns, or breakouts to gauge conviction.
Use bullish or bearish arrows as filters, only take trades when price action aligns with strong directional pressure.
Watch neutral arrows near key levels; they often foreshadow balance breaking into directional moves.
Adjust the weightings to emphasize the components that matter most to your style (e.g., more weight on CVD for scalpers, or ATR expansion for volatility traders).
As with any indicator, this is not a magic ball and does not guarantee success. But it does allow you to increase the probability odds to your favor if you align it with your edge. Happy trading!

Liquidity Void Detector (Zeiierman)█ Overview
Liquidity Void Detector (Zeiierman) is an oscillator highlighting inefficient price displacements under low participation. It measures the most recent price move (standardized return) and amplifies it only when volume is below its own trend.
Positive readings ⇒ strong up-move on low volume → potential Buy-Side Imbalance (void below) that often refills.
Negative readings ⇒ strong down-move on low volume → potential Sell-Side Imbalance (void above) that often refills.
This tool provides a quantitative “void” proxy: when price travels far with unusually thin volume, the move is flagged as likely inefficient and prone to mean-reversion/mitigation.
█ How It Works
⚪ Volume Shock (Participation Filter)
Each bar, volume is compared to a rolling baseline. This is then z-scored.
// Volume Shock calculation
volTrend = ta.sma(volume, L)
vs = (volume > 0 and volTrend > 0) ? math.log(volume) - math.log(volTrend) : na
vsZ = zScore(vs, vzLen) // z-scored volume shock
lowVS = (vsZ <= vzThr) // low-volume condition
Bars with VolShock Z ≤ threshold are treated as low-volume (thin).
⚪ Prior Return Extremeness
The 1-bar log return is computed and z-scored.
// Prior return extremeness
r1 = math.log(close / close )
retZ = zScore(r1, rLen) // z-scored prior return
This shows whether the latest move is unusually large relative to recent history.
⚪ Void Oscillator
The oscillator is:
// Oscillator construction
weight = lowVS ? 1.0 : fadeNoLow
osc = retZ * weight
where Weight = 1 when volume is low, otherwise fades toward a user-set factor (0–1).
Osc > 0: up-move emphasized under low volume ⇒ Buy-Side Imbalance.
Osc < 0: down-move emphasized under low volume ⇒ Sell-Side Imbalance.
█ Why Use It
⚪ Targets Inefficient Moves
By filtering for low participation, the oscillator focuses on moves most likely driven by thin books/noise trading, which are statistically more likely to retrace.
⚪ Simple, Robust Logic
No need for tick data or order-book depth. It derives a practical void proxy from OHLCV, making it portable across assets and timeframes.
⚪ Complements Price-Action Tools
Use alongside FVG/imbalance zones, key levels, and volume profile to prioritize voids that carry the highest reversal probability.
█ How to Use
Sell-Side Imbalance = aggressive sell move (price goes down on low volume) → expect price to move up to fill it.
Buy-Side Imbalance = aggressive buy move (price goes up on low volume) → expect price to move down to fill it.
█ Settings
Volume Baseline Length — Bars for the volume trend used in VolShock. Larger = smoother baseline, fewer low-volume flags.
Vol Shock Z-Score Lookback — Bars to standardize VolShock; larger = smoother, fewer extremes.
Low-Volume Threshold (VolShock Z ≤) — Defines “thin participation.” Typical: −0.5 to −1.0.
Return Z-Score Lookback — Bars to standardize the 1-bar log return; larger = smoother “extremeness” measure.
Fade When Volume Not Low (0–1) — Weight applied when volume is not low. 0.00 = ignore non-low-volume bars entirely. 1.00 = treat volume condition as irrelevant (pure return extremeness).
Upper Threshold (Osc ≥) — Trigger for Sell-Side Imbalance (void below).
Lower Threshold (Osc ≤) — Trigger for Buy-Side Imbalance (void above).
-----------------
Disclaimer
The content provided in my scripts, indicators, ideas, algorithms, and systems is for educational and informational purposes only. It does not constitute financial advice, investment recommendations, or a solicitation to buy or sell any financial instruments. I will not accept liability for any loss or damage, including without limitation any loss of profit, which may arise directly or indirectly from the use of or reliance on such information.
All investments involve risk, and the past performance of a security, industry, sector, market, financial product, trading strategy, backtest, or individual's trading does not guarantee future results or returns. Investors are fully responsible for any investment decisions they make. Such decisions should be based solely on an evaluation of their financial circumstances, investment objectives, risk tolerance, and liquidity needs.

EMA Range OscillatorEMA Range Oscillator (ERO) - User Guide
Overview
The EMA Range Oscillator (ERO) is a technical indicator that measures the distance between two Exponential Moving Averages (EMAs) and the distance between price and EMA. It normalizes these distances into a 0-100 range, helping traders identify trend strength, market momentum, and potential reversal points.
Components
Main Line
Green Line: EMA20 > EMA50 (Uptrend)
Red Line: EMA20 < EMA50 (Downtrend)
Histogram
White Histogram: Price distance from EMA20
Key Levels
Upper Level (80): High divergence zone
Middle Level (50): Neutral zone
Lower Level (20): Low divergence zone
Parameters
ParameterDefaultDescriptionFast EMA20Short-term EMA periodSlow EMA50Long-term EMA periodNormalization Period100Lookback period for scalingUpper80Upper threshold levelLower20Lower threshold level
How to Read the Indicator
High Values (Above 80)
Strong trend in progress
EMAs are widely separated
High momentum
Potential overbought/oversold conditions
Watch for possible trend exhaustion
Low Values (Below 20)
Consolidation phase
EMAs are close together
Low volatility
Potential breakout setup
Range-bound market conditions
Middle Zone (20-80)
Normal market conditions
Moderate trend strength
Balanced momentum
Look for directional clues from color changes

SCTI-D1SCTI-D1 Indicator Introduction / 指标简介
The SCTI-D1 (Smart Composite Trading Indicator - Daily) is a comprehensive, multi-feature trading tool designed for serious traders who demand depth, flexibility, and clarity in their market analysis. This indicator combines several powerful concepts into one seamless workflow, including:
Multiple EMA Systems with customizable lengths and visibility
PMA (Projected Moving Average) with fill options between lines
VWAP with configurable anchors and deviation bands
Divergence Detection for MACD and Histogram
Volume Profile with node detection (peaks, troughs, highs, lows)
Smart Money Concepts including order blocks, fair value gaps, equal highs/lows, and market structure shifts
Whether you trade stocks, forex, or cryptocurrencies, the SCTI-D1 helps you identify key levels, track institutional activity, and spot high-probability reversal signals—all in one clean, customizable interface.
SCTI-D1 指标简介
SCTI-D1(智能综合交易指标 - 日线版)是一款功能全面的交易工具,专为需要深度、灵活性和清晰市场分析的专业交易者设计。该指标将多种强大概念融合在一个流畅的工作流程中,包括:
多组EMA系统,可自定义长度和显示
PMA(投影移动平均线),支持均线间填充色
VWAP,可配置锚定周期和偏差带
背离检测,支持MACD和柱状图
成交量分布,支持节点检测(峰值、谷值、最高、最低)
聪明钱概念,包括订单块、公允价值缺口、等高/等低和市场结构转换
无论您交易股票、外汇还是加密货币,SCTI-D1 都能帮助您识别关键水平、跟踪机构资金动向并发现高概率反转信号——所有功能均集成在一个清晰可定制的界面中。

CVD Absorption + Confirmation [Orderflow & Volume]This indicator detects bullish and bearish absorption setups by combining Cumulative Volume Delta (CVD) with price action, candlestick, and volume confirmations.
🔹 What is Absorption?
Absorption happens when aggressive buyers/sellers push CVD to new highs or lows, but price fails to follow through.
Bearish absorption: CVD makes a higher high, but price does not.
Bullish absorption: CVD makes a lower low, but price does not.
This often signals that limit orders are absorbing aggressive market orders, creating potential reversal points.
🔹 Confirmation Patterns
Absorption signals are only shown if they are validated by one of the following patterns:
Engulfing candle with low volume → reversal faces little resistance.
Engulfing candle with high volume → strong aggressive participation.
Pin bar with high volume → absorption visible in the wick.
CVD flattening / slope reversal → shift in aggressive order flow.
🔹 Signals
✅ Bullish absorption confirmed → Green label below the bar.
❌ Bearish absorption confirmed → Red label above the bar.
Each label represents a potential reversal setup after orderflow absorption is validated.
🔹 Alerts
Built-in alerts are included for both bullish and bearish confirmations, so you can track setups in real-time without watching the chart 24/7.
📌 How to Use:
Best applied at key levels (supply/demand, VWAP, OR, liquidity zones).
Look for confluence with your trading strategy before taking entries.
Works on all markets and timeframes where volume is reliable.

HTF POC with Zones & AlertsPlots a Point of Control (POC) per candle from a timeframe you choose (MTF). Because TradingView doesn’t expose true footprint data, the POC here is a proxy (choose: Body Mid, Range Mid, or Typical Price HLC3). The script draws the POC line and an optional POC zone (±% of that candle’s range), then alerts when price retests the zone (wick touches count).
Use it to:
Mark key levels inside candles that often act as magnets or reaction zones
Track retests of strong bars (imbalance) across higher timeframes
Add clean confluence with S/R, FVGs, or trend tools
Features: Selectable TF, zone width, extend lines/zones, historical caps, alerts, and info panel.
Note: This is an estimate of POC from OHLC, not real bid/ask volume. Use as context, not a standalone signal.

Volume Imbalance Analyzer - 70% & 80% Version1.01Here’s a clean “definition” you can drop into your docs. It explains **what** the indicator is, **what it helps with**, and **how** to use it—plain and practical.
# Definition
**Volume Imbalance Analyzer (70% & 80%)** flags bars where estimated buy vs. sell volume is heavily one-sided. It colors those bars, adds labels (B70/B80 or S70/S80), and can alert you in real time. The goal is to quickly spot spots of **aggressive participation** (buyers or sellers) that often act as magnets for a **retest** or as **exhaustion/continuation** areas.
# What it helps you do
* **Find high-energy bars** where one side dominates (potential turning or continuation points).
* **Plan retests:** Track when price comes back into the imbalance candle’s range (common entry/take-profit logic).
* **Filter trades:** Only act when the market shows unusual pressure (≥70% or ≥80%).
* **Add context to setups:** Combine with S/R, FVGs, or trend tools to time entries with less guesswork.
* **Alert-driven workflow:** Get notified the moment extreme pressure prints.
# How it helps (workflow)
1. **Scan for signals:**
* **B80/B70** = strong buying; **S80/S70** = strong selling.
* 80% is “extreme” and overrides 70%.
2. **Mark the zone:** The imbalance candle’s **high–low** defines a zone. Many traders wait for a **retest** into that range.
3. **Decide intent:**
* After **B80/B70**, look for pullbacks to buy (or fades if you see exhaustion).
* After **S80/S70**, look for rallies to sell (or fades if exhaustion).
4. **Confirm with context:** Check trend, key levels, liquidity, session timing, ATR/volatility.
5. **Manage risk:** Place stops beyond the zone; size trades so a failed retest doesn’t ruin the day.
# How it works (under the hood, briefly)
The script **estimates buy/sell volume** from each candle’s body, wicks, and total volume, then computes an **imbalance %**. If the % crosses **70%** or **80%** (scaled by a Sensitivity setting), it paints the bar, drops a label, and optionally fires an alert. It also stores the imbalance candle’s range so you can watch for a **retest**.
# Reading the signals (quick guide)
* **B80**: Extreme buyer pressure → watch for pullback buys or exhaustion shorts, depending on context.
* **B70**: Strong buyer pressure → mild continuation bias.
* **S80**: Extreme seller pressure → watch for rally sells or exhaustion longs.
* **S70**: Strong seller pressure → higher reversal probability noted in the table (informational).
# Configuration tips
* **Sensitivity**: Higher = more bars qualify (more signals).
* **Label distance**: Scales with ATR so labels don’t overlap candles.
* **Colors/opacity**: Separate for 70% vs 80% and buyer vs seller.
* **Alerts**: Enable to catch signals live without staring at the screen.
# Notes & limits
* Uses **estimation** (not true bid/ask) on most symbols; treat as a **context tool**, not a stand-alone system.
* The optional stats table’s “expected outcomes” are **informational**, not live probabilities.
* Works on any timeframe; results improve when combined with structure and risk controls.

Asian & London Session High/LowMarks out asian session high and low, aswell as london session high and low, this makes it easier for you to have crucial key levels on your chart at all times

Session Key Levels Lines (with Labels)This is an extension of the previous indicator, it just plots all the information you need automatically for you so you dont have to lift a finger. hope it helps :)

Momentum Reversal StrategyBEST USE IN 15MIN TIME FRAME EURUSD / XAUSUD
1. Strategy Overview
This strategy hunts short-term momentum reversals at key levels during high-liquidity sessions.
Timeframes: 5-minute for entries; 15-minute for trend context
Sessions: London for EUR/USD & GBP/USD; New York for XAU/USD
Pairs: EUR/USD, GBP/USD, XAU/USD
Indicators (3 max):
EMA(20) and EMA(50) (close)
MACD (12, 26, 9) histogram
Optional: RSI(14) (for divergence filter)
2. Entry Rules
Trend Filter (15 min):
Long only if EMA20 > EMA50; short only if EMA20 < EMA50.
Price-Action Zone (5 min):
Identify recent swing high/low within past 20 bars.
Draw horizontal support (for longs) or resistance (for shorts).
Indicator Alignment (5 min):
MACD histogram crossing from negative to positive for longs, positive to negative for shorts.
Candle close beyond EMA20 in direction of trade.
Candle Confirmation:
Bullish engulfing or hammer at support for longs; bearish engulfing or shooting star at resistance for shorts.
Entry Execution:
Place market order on candle close that meets all above.
3. Exit Rules
Stop-Loss (SL):
Long: 1.5× ATR(14) below entry candle low.
Short: 1.5× ATR(14) above entry candle high.
Take-Profit (TP):
Set at 2× SL distance (RR 1:2).
Trailing SL:
After price moves 1× SL in profit, trail SL to breakeven.
Partial Booking:
Close 50% at 1× SL (50% of TP), move SL to entry.
Close remaining at full TP.
4. Trade Management
False Signal Filter: Skip trades when RSI(14) > 70 for longs or < 30 for shorts (avoids overbought/oversold extremes).
One Trade at a Time: No multiple positions on same pair.
Session Cutoff: Close any open trade 15 minutes before session end.
5. Risk Parameters
Risk per Trade: 1% of account equity.
Reward Target: ≥2% (1:2 RR) per trade.
Win-Rate Expectancy: ≥75% based on indicator confluence and price-action confirmation.

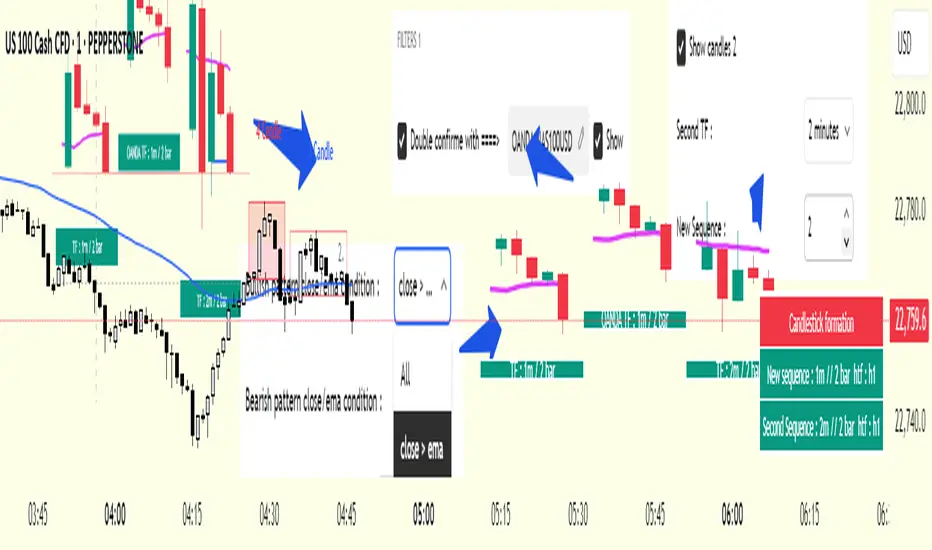
cd_secret_candlestick_patterns_CxHi traders,
With this indicator, we aim to uncover secret candlestick formations that even advanced traders may miss—especially those that can't be detected by classic pattern indicators, unless you're a true master of candlestick patterns or candle math.
________________________________________
General Idea:
We'll try to identify candlestick patterns by regrouping candles into custom-sized segments that you define.
You might ask: “Why do I need this? I can just look at different timeframes and spot the structure anyway.” But it’s not the same.
For example, if you're using a 1-minute chart and add a higher-timeframe candle overlay (like 5-minute), the candles you see start at fixed timestamps like 0, 5, 10, etc.
However, in this indicator, we redraw new candles by grouping them from the current candle backward in batches of five.
These candles won't match the standard view—only when aligned with exact time multiples (e.g., 0 and 5 minutes) will they look the same.
In classic charts:
• You see 5-minute candles that begin every 0 and 5 minutes.
In this tool:
• You see a continuously updating set of 5 merged 1-minute candles redrawn every minute.
What about the structures forming in between those fixed timeframes?
That’s exactly what we’ll be able to detect—while also making the lower timeframe chart more readable.
________________________________________
Candle Merging:
Let’s continue with an example.
Assume we choose to merge 5 candles. Then the new candle will be formed using:
open = open
close = close
high = math.max(high , high , high , high , high)
low = math.min(low , low , low , low , low)
This logic continues backward on the chart, creating merged candles in groups of 5.
Since the selected patterns are made up of 3, 4, or 5 candles, we redraw 5 such merged candles to analyze.
________________________________________
Which Patterns Are Included?
A total of 18 bullish and bearish patterns are included.
You’ll find both widely known formations and a few personal ones I use, marked as (MeReT).
You can find the pattern list and visual reference here:
________________________________________
Entry and Filtering Suggestions:
Let me say this clearly:
Entering a trade every time a pattern forms will not make you profitable in the long run.
You need a clear trade plan and should only act when you can answer questions like:
• Where did the pattern appear?
• When and under what conditions?
It’s more effective to trade in the direction of the trend and look for setups around support/resistance, supply/demand zones, key levels, or areas confirmed by other indicators.
Whether you enter immediately after the pattern or wait for a retest is a personal choice—but risk management is non-negotiable.
One of the optional filters I’ve included is a Higher Timeframe (HTF) condition, which is my personal preference:
When enabled, the highest or lowest price among the pattern candles must match the high or low of the current HTF candle.
You can see in the image below the decrease in the number of detected patterns on the 1-minute chart when using no filter (blue labels) compared to when the 1-hour timeframe filter is applied (red labels).
Additionally, I’ve added a “protected” condition for engulfing patterns to help filter out weak classic engulf patterns.
________________________________________
Settings:
From the menu, you can configure:
• Number of candles for regrouping
• Distance between the last candle and newly drawn candles
• Show/hide options
• HTF filter toggle and timeframe selection
• Color, label placement, and text customization
• Pattern list (select which to display or trigger alerts for)
My preferred setup:
While trading on the 1-minute chart, I typically set the higher timeframe to 15m or 1H, and switch the candle count between 2 and 3 depending on the situation.
⚠️ Important note:
The “Show” and “Alert” options are controlled by a single command.
Alerts are automatically created for any pattern you choose to display.
________________________________________
What’s Next?
In future updates, I plan to add:
• Pattern success rate statistics
• Multi-broker confirmation for pattern validation
Lastly, keep in mind:
The more candles a pattern is based on, the more reliable it may be.
I'd love to hear your feedback and suggestions.
Cheerful trading! 🕊️📈
Average RSI (Daily + Weekly)📈 Average RSI (Relative Strength Index) – Beginner’s Guide
What it is:
The Average RSI is a technical indicator that combines multiple RSI values—such as daily and weekly RSI—into a single, smoothed line. This helps traders get a clearer picture of a stock’s momentum over both short- and medium-term timeframes.
Why it matters:
The RSI tells you whether a stock is potentially overbought (priced too high and due for a pullback) or oversold (priced too low and due for a bounce). Traditional RSI uses a scale from 0 to 100, with key levels at 70 (overbought) and 30 (oversold).
By averaging RSI across different timeframes, you reduce noise and get a better signal for trends and reversals.
How traders use it:
✅ Buy zone: When the average RSI dips below 40, it could signal a good entry point.
⚠️ Neutral zone: Between 40 and 60 means the trend isn’t strong—wait for more confirmation.
🚫 Sell zone: Above 60–70 may indicate the asset is overbought or due for a pullback.
Helpful for:
Spotting better entry/exit points
Filtering out false signals
Staying in trend-following trades longer

Custom Session Tracker (KN)**Custom Session Tracker (KN)**
Visually highlight any intraday session’s high, low, and midpoint on your chart with full styling control.
**Description**
Custom Session Tracker (KN) lets you define any trading session (e.g. 09:30–16:00 NY time) and automatically draws:
* A translucent box spanning the session’s High and Low
* A horizontal line marking the session midpoint
All elements update in real time and persist after session close.
**Features**
* **Session Range Box**: Plots from session open through close
* **Mid-Price Line**: Marks the exact midpoint of High/Low
* **Timezone Input**: Aligns session to any GMT offset
* **Custom Colors**: Fill, border, and mid-line colors
* **Line & Border Styles**: Choose solid or dashed
**Inputs**
* **Timezone** – GMT offset for your market
* **Session** – Hours in `HHMM-HHMM` format
* **Fill Color** – Box interior transparency
* **Border Color** – Box outline
* **Box Border Style** – Solid or dashed
* **Midline Color** – Mid-price line color
* **Mid Price Line Style** – Solid or dashed
**How to Use**
1. Add the script to your chart.
2. Set your session hours and timezone.
3. Customize colors and styles.
4. Watch each session’s high, low, and midpoint appear automatically.
Perfect for session-overlap strategies, mean-reversion signals, or simply keeping key levels in view.

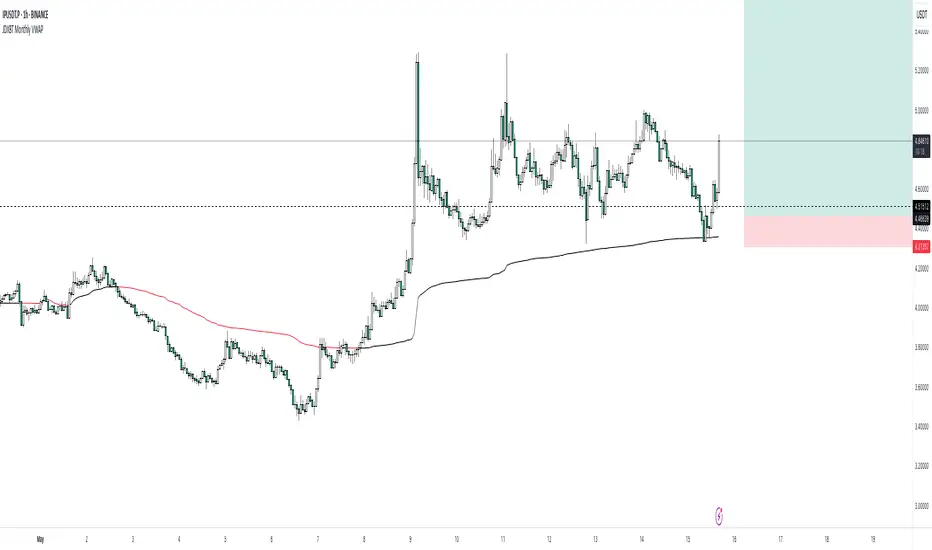
JDXBT Monthly VWAPIt calculates the average price for each month, weighted by trading volume, and automatically resets the calculation at the start of each new month. The VWAP line changes colour based on direction: black if rising, fuchsia if falling — helping traders quickly identify monthly price trends with volume context. It’s a useful tool for spotting key levels and momentum shifts on a monthly basis.
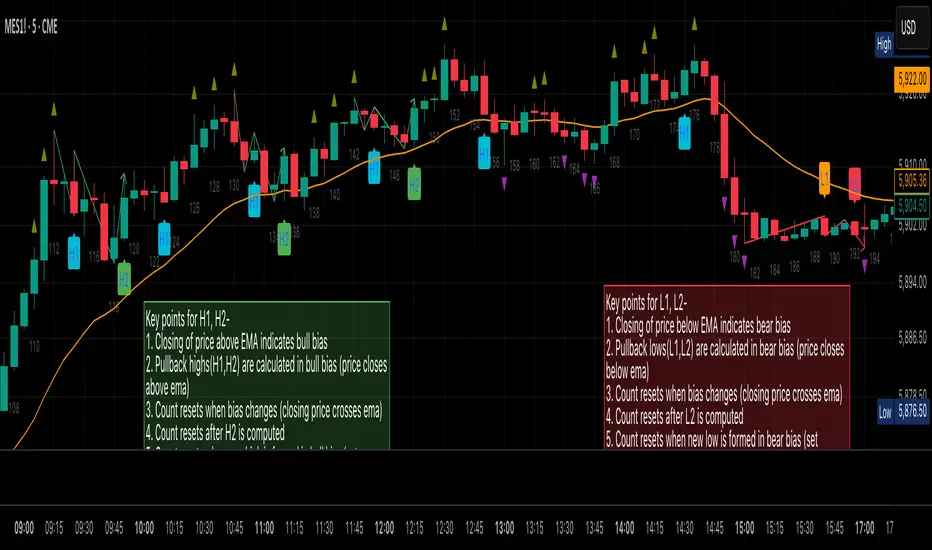
Al Brooks Second Entry**\ Al Brooks Second Entry Indicator\ **
This custom indicator helps identify second-entry setups based on Al Brooks' price action principles. The script marks key levels in trending markets, indicating potential long and short entries. It displays the first and second entry signals (H1, H2, L1, L2) as well as relevant pullback zones for added clarity.
\ Features:\
\
\ \ First Entry Signals\ : H1 (Long) and L1 (Short) are marked when a trend begins to form.
\ \ Second Entry Signals\ : H2 (Long) and L2 (Short) are plotted once the market pulls back and continues in the direction of the trend.
\ \ EMA Filter\ : An Exponential Moving Average (EMA) is included to filter trades in the direction of the trend (longs above EMA, shorts below EMA).
\ \ Pullback Zones\ : Highlighted areas to assist in identifying optimal zones for entry.
\ \ Adjustable Label Sizes\ : Customize the appearance of the entry labels (tiny or small).
\
\ Inputs:\
\
\ \ Show First/Second Entry\ : Control whether the first (H1, L1) and second (H2, L2) entry signals are displayed.
\ \ EMA Length\ : Set the length of the EMA to use for trend direction.
\ \ Label Size\ : Choose between tiny and small label sizes for clear chart visibility.
\ \ Pullback Zones\ : Toggle the highlighting of pullback zones.
\
\ How it Works:\
\
\ The indicator detects a trend direction using price action (new highs/lows, inside/outside bars).
\ Once a trend is identified, it waits for a pullback and marks the first and second entry points (H1, H2, L1, L2).
\ The indicator also plots the EMA to help confirm the overall market bias.
\ Pullback zones are drawn to help spot potential areas of support or resistance.
\
This script is ideal for traders looking to trade retracements in trending markets, providing clear entry signals and a visual representation of market structure.
Intraday Trading IndicatorIndicator Overview
Moving Averages: Uses a fast EMA (9-period) and a slow EMA (21-period) to determine the trend direction.
Market Profile Approximation: Utilizes VWAP (Volume Weighted Average Price) as a simplified proxy for value area, acting as a dynamic support/resistance level.
SMC: Incorporates the concept of trend confirmation and price interaction with key levels, focusing on pullbacks to the fast EMA within a trending market.
Signals: Generates buy and sell signals when price crosses the fast EMA, filtered by the trend (fast EMA vs. slow EMA) and VWAP position, aiming for high-probability setups.
This design ensures responsiveness on short timeframes while filtering out noise, aligning with the goal of accurate signals for intraday trading.

Bullish and Bearish Breakout Alert for Gold Futures PullbackBelow is a Pine Script (version 6) for TradingView that includes both bullish and bearish breakout conditions for my intraday trading strategy on micro gold futures (MGC). The strategy focuses on scalping two-legged pullbacks to the 20 EMA or key levels with breakout confirmation, tailored for the Apex Trader Funding $300K challenge. The script accounts for the Daily Sentiment Index (DSI) at 87 (overbought, favoring pullbacks). It generates alerts for placing stop-limit orders for 175 MGC contracts, ensuring compliance with Apex’s rules ($7,500 trailing threshold, $20,000 profit target, 4:59 PM ET close).
Script Requirements
Version: Pine Script v6 (latest for TradingView, April 2025).
Purpose:
Bullish: Alert when price breaks above a rejection candle’s high after a two-legged pullback to the 20 EMA in a bullish trend (price above 20 EMA, VWAP, higher highs/lows).
Bearish: Alert when price breaks below a rejection candle’s low after a two-legged pullback to the 20 EMA in a bearish trend (price below 20 EMA, VWAP, lower highs/lows).
Context: 5-minute MGC chart, U.S. session (8:30 AM–12:00 PM ET), avoiding overbought breakouts above $3,450 (DSI 87).
Output: Alerts for stop-limit orders (e.g., “Buy: Stop=$3,377, Limit=$3,377.10” or “Sell: Stop=$3,447, Limit=$3,446.90”), quantity 175 MGC.
Apex Compliance: 175-contract limit, stop-losses, one-directional news trading, close by 4:59 PM ET.
How to Use the Script in TradingView
1. Add Script:
Open TradingView (tradingview.com).
Go to “Pine Editor” (bottom panel).
Copy the script from the content.
Click “Add to Chart” to apply to your MGC 5-minute chart .
2. Configure Chart:
Symbol: MGC (Micro Gold Futures, CME, via Tradovate/Apex data feed).
Timeframe: 5-minute (entries), 15-minute (trend confirmation, manually check).
Indicators: Script plots 20 EMA and VWAP; add RSI (14) and volume manually if needed .
3. Set Alerts:
Click the “Alert” icon (bell).
Add two alerts:
Bullish Breakout: Condition = “Bullish Breakout Alert for Gold Futures Pullback,” trigger = “Once Per Bar Close.”
Bearish Breakout: Condition = “Bearish Breakout Alert for Gold Futures Pullback,” trigger = “Once Per Bar Close.”
Customize messages (default provided) and set notifications (e.g., TradingView app, SMS).
Example: Bullish alert at $3,377 prompts “Stop=$3,377, Limit=$3,377.10, Quantity=175 MGC” .
4. Execute Orders:
Bullish:
Alert triggers (e.g., stop $3,377, limit $3,377.10).
In TradingView’s “Order Panel,” select “Stop-Limit,” set:
Stop Price: $3,377.
Limit Price: $3,377.10.
Quantity: 175 MGC.
Direction: Buy.
Confirm via Tradovate.
Add bracket order (OCO):
Stop-loss: Sell 175 at $3,376.20 (8 ticks, $1,400 risk).
Take-profit: Sell 87 at $3,378 (1:1), 88 at $3,379 (2:1) .
Bearish:
Alert triggers (e.g., stop $3,447, limit $3,446.90).
Select “Stop-Limit,” set:
Stop Price: $3,447.
Limit Price: $3,446.90.
Quantity: 175 MGC.
Direction: Sell.
Confirm via Tradovate.
Add bracket order:
Stop-loss: Buy 175 at $3,447.80 (8 ticks, $1,400 risk).
Take-profit: Buy 87 at $3,446 (1:1), 88 at $3,445 (2:1) .
5. Monitor:
Green triangles (bullish) or red triangles (bearish) confirm signals.
Avoid bullish entries above $3,450 (DSI 87, overbought) or bearish entries below $3,296 (support) .
Close trades by 4:59 PM ET (set 4:50 PM alert) .

[blackcat] L3 Magic-9 Sequential SetupOVERVIEW
The L3 Magic-9 Sequential Setup indicator is designed to identify potential reversal points in the market using a sequential pattern analysis. This script plots specific labels on the chart based on predefined conditions, helping traders spot key levels where price reversals might occur 📉↗️.
FEATURES
Identifies consecutive occurrences of price movements above or below certain thresholds.
Plots labeled markers on the chart for easy visualization:
Red Labels: Indicate potential sell signals (e.g., '5', '6', '7', etc.).
Green Labels: Indicate potential buy signals (e.g., '5', '6', '7', etc.)
Uses custom functions to filter and count occurrences over specified lookback periods ⚙️.
Changes bar colors based on detected signals for enhanced visual cues 🎨.
Supports extensive customization through input parameters for fine-tuning the setup.
HOW TO USE
Add the indicator to your TradingView chart by selecting it from the indicators list.
Observe the plotted labels ('5', '6', '7', etc.) indicating potential reversal zones.
Pay attention to bar color changes that confirm the identified patterns.
Combine this indicator with other tools for confirmation before making trading decisions.
LIMITATIONS
The indicator relies heavily on sequential patterns, which may not capture all market nuances.
False signals can occur in ranging or sideways markets 🌪️.
Users should always confirm signals with other forms of analysis.
NOTES
Ensure that you have sufficient historical data available for accurate calculations.
Test the indicator thoroughly on demo accounts before applying it to live trading 🔍.
Customize input parameters as needed to fit your trading strategy.

Pump & Dump Detector (sensitive)📊 Pump & Dump Detector — Volatility & Volume-Based Impulse Scanner
Description:
This indicator is designed to detect early and confirmed signs of high-impact market movements, such as pumps (sharp price increases) and dumps (sharp price drops). It intelligently combines multiple market signals to provide timely alerts of potential momentum spikes.
🔧 Components & Logic:
1. Price Change (%):
Compares the current closing price to the previous one. This is used as the main trigger for confirmed pump or dump detection.
2. Volume Spike:
Detects abnormal activity by comparing the current volume to the moving average over a user-defined period. If the current volume exceeds the average by a specified multiplier (default: 1.8x), a spike is detected.
3. Volatility Spike (High - Low):
Measures bar expansion. A sudden increase in bar range often indicates breakout conditions or liquidation events.
4. NATR (Normalized ATR):
Normalized Average True Range is calculated as (ATR / Close) * 100, making volatility comparable across all timeframes and instruments.
5. Min Volume Filter:
Filters out signals from low-liquidity coins to reduce false alerts and market noise.
🧠 Why It’s Useful:
This is not a mashup of random indicators, but a thoughtfully engineered system where each filter strengthens the signal validity.
It allows you to spot explosive moves before they fully unfold, making it ideal for:
Intraday scalping
Altcoin watchlists
Flash crash detection
Early reversal or breakout trades
🖥 How to Use:
Add the indicator to any crypto chart.
Enable alerts for:
🚨 Early Pump
💥 Confirmed Pump
🔻 Early Dump
🔥 Confirmed Dump
React to confirmed signals using your preferred strategy — breakout, fade, or continuation.
Use in combination with key levels, orderbook data, or trend filters for best results.
📌 Example Use Case:
On a 5-minute chart of a low-cap altcoin, the indicator may issue an early signal when:
Price increases by more than 2.5%
Volume is 2x the average
Bar range is significantly larger than the recent average
NATR is above its smoothed average × 1.2
🛡 Originality & Purpose:
This script was not built to simply combine popular indicators, but to serve a very specific use-case — detecting early-stage pumps and dumps.
By blending classic tools (like volume, ATR) with contextual filters, it becomes a true pattern-based predictive signal, not a repackaged overlay.
💬 Have ideas or suggestions? Leave a comment below — I’m always open to collaboration!
